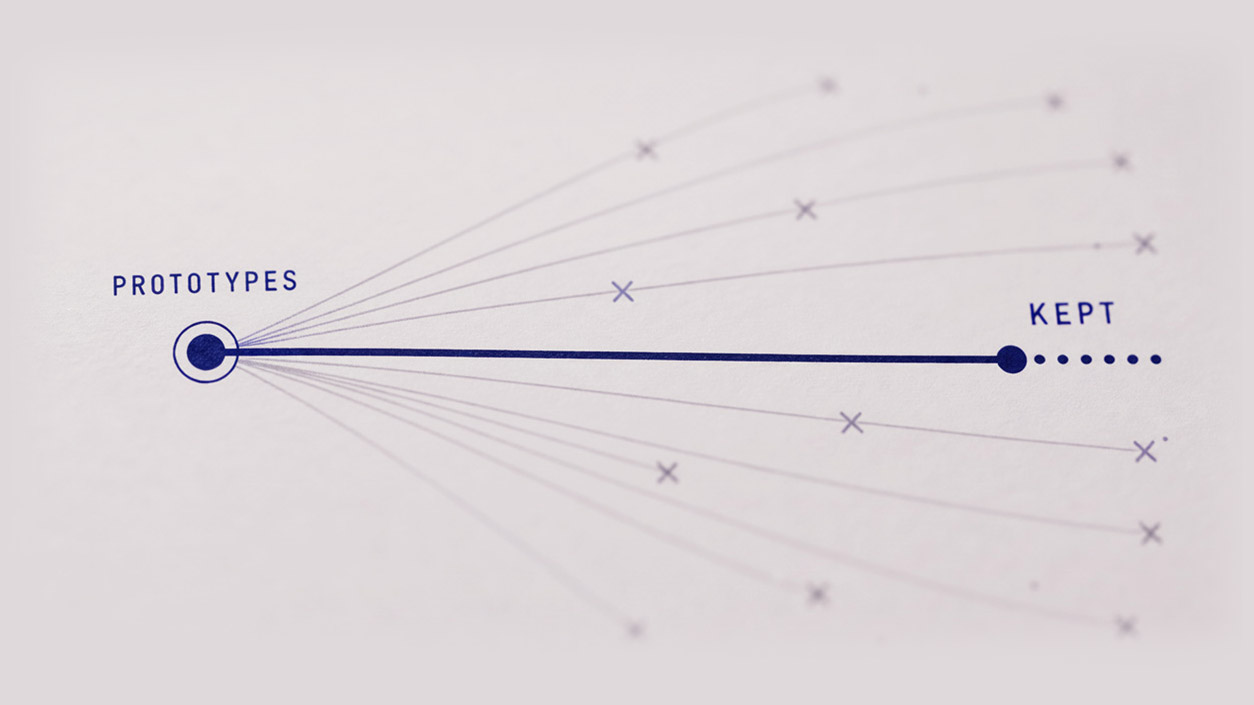
Generative AI promises to bring vast changes to industries as diverse as education, software engineering, law, healthcare, and marketing. From proof-of-concept deployments we know the technology can work, but fewer than 5% of those deployments make it to production. Crossing the chasm from “compelling prototype” to “real systems delivering real value to end users” requires solving problems that existing tooling wasn’t designed to handle–and, until those problems are addressed, the potential of generative AI will remain largely theoretical.
One factor lurking behind much of this difficulty is the inherently nondeterministic nature of the underlying generative systems. Because the exact same input can produce different outputs, the testing methods that engineers have converged on to cover deterministic software projects aren’t enough in this context, and problems often only become visible when users complain. Customer criticism is often an unreliable quality signal; a minor error on what seems like a straightforward question can trigger harsh feedback, while a poorly-formatted response containing a hard-to-find fact might earn praise.
This puts engineering teams in an impossible spot; they are deploying systems whose power stems from the fact that they’re open-ended, creative, and hard to predict, but the very same attributes make it difficult to measure the quality of their outputs, prevent degradations and failures, and justify the ROI on organization investments that often run into the millions. Compounding the problem, the engineering hours consumed by manual troubleshooting (which can be dozens of hours per incident) pull teams away from the innovative work they were hired for, creating a vicious cycle where generative AI investments demand more resources to maintain that they free up to deliver value.
The Tooling Mismatch
The observability tools that have helped monitor traditional infrastructure are ill-equipped for generative AI workloads. Platforms like Datadog, Prometheus, Splunk, and Grafana excel at tracking latency, throughput, and error rates, but they aren’t designed to tell you why your RAG pipeline started returning irrelevant context or what changed when your model outputs became noticeably less coherent.
Meanwhile, there are ways of measuring output quality, but uniting such metrics with the infrastructural context needed for effective, targeted troubleshooting requires tremendous wrangling. Even when teams succeed in consolidating this data, they face a second challenge: the resulting trace logs are often too long for manual review, and crucially, inconsistent—the same type of failure rarely produces the same error pattern or follows the same remediation path.
AI engineering teams have adapted by operating with a fragmented toolkit, often juggling three to five different platforms, hopping between dashboards to correlate infrastructure metrics with a bevy of different performance indicators and ground truth data.
The Missing Foundation
End-to-end, top-to-bottom telemetry is the foundation for understanding, diagnosing, and predicting generative AI performance, but most teams are deploying systems without the instrumentation necessary to consistently maintain a full-cycle view of their generative AI pipeline. They may track output quality or monitor semantic drift or correlate some model behavior with infrastructure events, but rarely all three simultaneously, and almost never with the granularity needed to trace a specific failure back through the complete execution chain.
Remediating these issues requires an observability approach purpose-built for the unique demands of generative AI, one that:
- Unifies infrastructure monitoring with AI-specific quality assessment;
- Operates within enterprise security constraints;
- Integrates with existing toolchains;
- Enables teams to define and track custom metrics specific to their use cases rather than forcing one-size-fits-all dashboards;
- Delivers actionable insights without vendor lock-in.
Solution Roadmap
The Prove AI platform is our solution to this problem, and it will be delivered in successive iterations.
The first iteration, v0.1, establishes the foundational infrastructure, focusing on streamlined deployment, secure telemetry collection, and unified monitoring. The goal is to get teams operating with a basic (but still complete) observability stack in far less time than is typically required.
The second iteration, v1.0, will build on this foundation to deliver what engineering teams ultimately need: actionable remediation that changes observability data into guided fixes and continuous improvement workflows.
In the sections below, we’ll cover these in more detail. And, while this roadmap focuses on our immediate deliverables, the platform’s architecture is designed to evolve toward deeper human-machine collaboration and increasingly automated issue resolution—capabilities that become possible once the foundational telemetry and remediation infrastructure is in place.
v0.1: Containerized Observability for Generative AI Models and Agents
v0.1 addresses the most pressing points of friction AI engineering teams face when they realize post-deployment that they need telemetry and begin trying to put observability systems in place, chiefly:
- Deployment complexity
- Setup time
- Self-hosting and data sovereignty
Containerized Deployment
Instead of reinventing observability tooling from the ground up, Prove AI’s v0.1 will deliver a hardened, containerized distribution of OpenTelemetry and Prometheus configured for generative AI models and agents.
While neither OpenTelemetry nor Prometheus is AI-specific, they represent best-in-class solutions for telemetry collection and metrics visualization, in addition to being proven, widely adopted, and enterprise-ready. Our approach is to take these industry standard tools and optimize them specifically for the unique observability challenges presented by generative AI and agent-focused systems.
This curated deployment dramatically reduces setup complexity in several ways. First, it provides preconfigured pipelines and settings suitable for most generative AI collection scenarios, eliminating the hundreds of engineer-hours that go into research and experimentation to determine optimal configurations. Second, containerization ensures dependency and version compatibility are managed automatically rather than requiring manual resolution. Third, the container-based approach provides deployment portability across development, staging, and production environments, whether on-premises or in the cloud.
Rapid Time-to-First-Metric
Prove AI’s v0.1 aims to dramatically reduce the time required to set up an observability stack. This will be achieved through preconfigured telemetry pipelines that work out of the box for inference endpoints, RAG pipelines, embedding services, agent frameworks, and other common architectures. In essence, teams will only need to instrument their code with standard OpenTelemetry SDKs, point their telemetry export to the Prove AI collector, and immediately start seeing metrics flow into Prometheus.
Self-Hosted, Customer-Chosen Data Architecture
For mid-to-large organizations, data sovereignty is a top priority, and they’ve so far had a total absence of suitable options. Telemetry data—especially from generative AI systems—often contains sensitive information such as user queries, model responses, retrieval context, and prompt templates. Sending this data to third-party SaaS platforms introduces compliance risk and violates many organizations’ security policies.
Prove AI’s v0.1 deploys entirely within the customer’s infrastructure, with telemetry data never leaving the customer’s chosen infrastructure. The collector, storage, and query interfaces all run on customer-controlled infrastructure, giving teams full ownership of their observability data. This architecture satisfies enterprise security requirements while maintaining the performance and reliability teams need to monitor production deployments.
Zero Lock-In, Open Interfaces
By building on industry-standard, open-source projects (OpenTelemetry and Prometheus), v0.1 ensures teams aren’t locked into proprietary formats or vendor-specific ecosystems. Telemetry data uses OpenTelemetry Protocol (OTLP), metrics follow Prometheus exposition format, and storage uses Prometheus’s TSDB. If teams later decide to switch vendors or build custom tooling, their instrumentation code and historical data remain portable.
Unified Interface
While v0.1 leverages Prometheus for metrics storage and querying, Prove AI provides a web-based interface that consolidates views across infrastructure and AI-specific metrics. Here, you can access pre-built dashboards, containing token throughput, model latency distributions, embedding service performance, and retrieval pipeline health—all in a single view.
v1.0: AI-Guided Agentic Remediation
Where v0.1 establishes a foundation in observability, v1.0 makes that foundation actionable. The shift here is a fundamental one: observability platforms traditionally excel at telling you what happened and when, but they leave the why and how to fix it entirely to the engineer. v1.0 inverts this model, with agentic remediation becoming the primary goal and observability serving that end.
From Detection to Diagnosis to Correction
v1.0 introduces a remediation engine purpose-built for generative AI failure modes. When a problematic output occurs (i.e., a hallucinated fact, an irrelevant retrieval, a coherence breakdown), the system won’t simply flag it; it will trace the complete execution path, guiding you to likely points of failure and resolution paths.
This full-context capture is a critical differentiator between traditional observability tools and Prove AI. The former shows you a trace with timestamps and some basic information; the latter will capture the full state of your pipeline: the actual prompts sent, the embeddings retrieved, the model outputs generated, and the evaluation scores computed. At long last, engineers will have everything they need to reconstruct every part of the chain that lead to a specific output, offering unprecedented visibility and a frontier of remediation pathways.
Automated Root-Cause Analysis
Rather than forcing engineers to manually correlate metrics across dashboards, v1.0 provides guided remediation workflows. When an issue surfaces, the system automatically:
- Identifies similar failure patterns in recent history
- Surfaces recent configuration or model changes that correlate with the failure
- Highlights anomalies in your metrics, such as those related to retrieval quality, prompt structure, or model behavior
- Suggests probable root causes based on the telemetry signature
- Shows you likely solution paths based on previous issue resolution
Armed with this context, troubleshooting becomes a targeted search for the specific issues involved.
Reinforcement and Continuous Improvement
Beyond one-time fixes, v1.0 enables continuous improvement through integrated reinforcement workflows. When engineers identify and correct issues, those corrections feed back into the system’s knowledge base; over time, this creates a dynamic understanding of your bespoke AI system’s failure modes, along with the remediation patterns that have proved successful in the past.
Deployment Flexibility
v1.0 maintains the same deployment flexibility as v0.1, with options for hyperscaler machine images (AWS AMI, Azure VM images, GCP machine images) or containerized on-premises deployments. The architecture remains customer-infrastructure-first, ensuring all remediation logic and associated data stay within your infrastructure.
For organizations operating multi-cloud or hybrid environments, the containerized approach provides consistent deployment across different infrastructure platforms without vendor-specific dependencies.
The Remediation-First Paradigm
The core insight driving v1.0 is that engineers ultimately want and need high-precision tools that reduce the total time spent looking at issues. v1.0 addresses the actual bottleneck in generative AI operations; observing problems isn’t the hard part, figuring out how to remediate powerful, stochastic systems is.
Conclusion
Generative AI’s transition from prototype to production demands observability tooling that matches the technology’s complexity. Traditional infrastructure monitoring falls short, AI-specific evaluation tools lack context, and the resulting patchwork of solutions creates more friction than insight.
Prove AI addresses this gap with a two-phase approach: immediate deployment of containerized, customer-controlled observability infrastructure in v0.1, followed by AI-guided remediation that transforms telemetry into actionable fixes in v1.0. By building on open standards while optimizing for GenAI workloads, the platform delivers enterprise-grade observability without vendor lock-in.
The ultimate measure of any observability platform isn’t the data it collects—it’s how quickly it helps teams resolve issues and prove the ROI of their technology investment. Prove AI is built for that reality.
Frequently asked questions
Prove AI is building solutions to power more correct, explainable and auditable AI outcomes.
We’re always interested in learning about AI management challenges.
Get in Touch