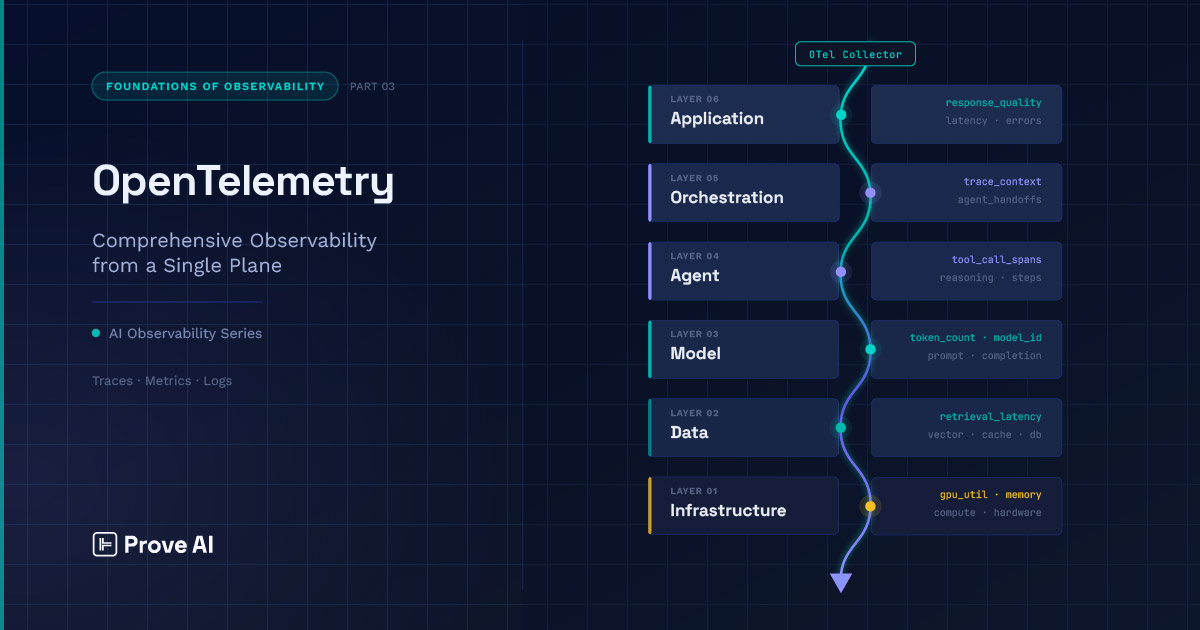
Part 2 of this series laid out the observability stack — six interdependent layers running from infrastructure through application, where failures at the bottom tend to surface at the top in forms that obscure their origin and derail investigations.
Knowing the stack exists, though, doesn’t equate to being able to see across it. The layers have different instrumentation requirements, which means you need a common instrumentation language that works across all of them. That’s what OpenTelemetry (OTel) provides, and it’s what this post is about.
OTel has emerged as the de facto instrumentation standard for distributed systems, and it’s extending into AI agent workloads through a set of active initiatives, the ultimate goal of which is to develop standardized conventions for capturing AI-specific metrics, such as:
- Token counts
- Model identifiers
- Prompt and completion content
- Latency breakdowns at the inference level
- Etc.
The practical implication is significant, as OTel gives you the common instrumentation language (the lingua observa) necessary to span the full stack. That language is what makes cross-layer analysis possible; otherwise, you’re cobbling together signals from incompatible systems that don’t natively have a shared context and hoping things line up correctly. This problem gets even more complicated when you consider the meteoric rise of multi-agent workflows, and all the myriad observability challenges it has brought with it.
OTel alone doesn’t solve every problem along the stack, of course, but it’s a powerful connective tissue, making it possible to create a unified solution out of disparate components.
With that in mind, let’s get into the specifics of OpenTelemetry.
How OpenTelemetry Works
OpenTelemetry is built around three signal types: the well-known ‘traces,’ ‘metrics,’ and ‘logs.’ Traces follow a particular stream of activity from start through execution, capturing the sequence of operations that produced a result and how long each one took. Metrics aggregate behavior over time — counts, rates, distributions — giving you a statistical picture of how the system performs across many requests rather than on any single one. Logs capture discrete events: something happened, at this time. Each signal type answers a different question, and a mature observability setup uses all three.
The atomic unit of a trace is the span. A span represents a single operation — its start time, duration, a set of attributes describing what happened, and pointers to its parent and child spans. A trace is the directed acyclic graph formed by those spans, a structured record of every operation that contributed to handling a request, stitched together by the relationships between spans. This is the mental model that everything else in OTel builds on. When you’re debugging a multi-step AI pipeline, what you’re ultimately doing is reading that graph and asking where the work went wrong.
Getting signals from instrumented code into a backend system is the Collector’s job. Instrumented services emit telemetry to the Collector, which processes it and forwards it to whatever backend you’re using. The pipeline has three stages: receivers ingest data from one or more sources, processors transform or filter it, and exporters send it downstream. That middle stage is important. Sampling decisions, attribute redaction, routing to multiple backends — these happen in the processor layer, which means the Collector is doing real work, not just forwarding packets.
This architecture offers the practical advantage of decoupling your instrumentation code from your backend; you write to the OpenTelemetry (OTel) API, and the Collector manages the rest. This separation is particularly vital for AI and multi-agent workloads, where the observability stack is often more complex than a standard distributed system, and the backends are likely to evolve as tooling matures. Maintaining deep visibility into the generation process (“the how and why”) of AI output is important today and will surely be more important tomorrow. As luck would have it, there are ongoing standardization efforts within the OTel ecosystem aimed at expanding conventions to cover signals from AI and multi-agent systems; as these stabilize, cross-tool analysis stands to become significantly more tractable.
Context Propagation in Multi-Agent Systems
In a conventional distributed system, context propagation is a well-studied problem. A trace context — a trace ID and a span ID — gets injected into outgoing requests as a header, extracted by the receiving service, and used to nest new spans under the same trace. The result is a complete picture of a request’s journey across service boundaries, stitched together by a handful of bytes passed along a predictable call chain. The execution path is known at deploy time, the communication patterns are mostly synchronous and structured (leaving aside exceptions like async calls and batch jobs), and the context travels naturally with the work.
Multi-agent AI systems break most of those assumptions. A LangGraph workflow doesn’t follow a linear execution path; nodes fire conditionally, loops are possible, and the graph structure may not be fully determined until the system has interpreted the incoming request and decided how to decompose it. Tool calls may spawn sub-agents that themselves invoke models, produce intermediate results, and terminate before the parent agent has finished its own work. The execution graph is assembled at runtime, not defined at deploy time, and it looks nothing like the call trees that standard distributed tracing was designed to capture.
The failure modes this creates are specific and consequential, including scenarios where:
- Context gets dropped at async boundaries when a task is handed off without carrying the originating trace context forward.
- Tool call spans are created without a valid parent, producing orphaned nodes that will be difficult to connect to the trace they belong to (assuming they can be tracked down at all).
- Parallel agent branches that execute concurrently and then merge later generate spans that are structurally ambiguous, where it’s not always clear which branch a given span should be attributed to, or how to represent their relationship.
The visible result is a broken trace: disconnected spans, missing links in the causal chain, and a reconstruction of what happened that has gaps precisely where continuity is most desperately needed.
What makes this particularly hard to get right is that each of these failure modes can be invisible until you need the trace. Instrumentation that looks correct in development — spans are being emitted, the Collector is receiving them — may, nevertheless, be silently dropping context at async handoff points that only surface under the concurrency patterns of a real production workload. And the cost of getting it wrong goes beyond merely an incomplete dashboard, ultimately undermining the causal chain that makes root cause analysis possible at all. A trace that can’t tell you which agent decision preceded a downstream failure could be deeply misleading, as it suggests a clean execution path where a broken one existed.
This is one of the places where the gap between instrumenting a system and observing it meaningfully is widest. Emitting spans is straightforward enough; ensuring that context propagates correctly across async boundaries, agent handoffs, and dynamic delegation structures requires sound engineering choices at every point where work crosses a process or thread boundary.
It’s also one of the harder problems to solve from first principles when assembling the stack yourself, providing a clear and compelling argument for instrumentation that’s been built and validated for these execution patterns specifically.
Where OpenTelemetry Ends
OpenTelemetry gives you a precise structural record of what your system did. A well-instrumented AI pipeline will tell you which model was called, what was passed in, what came back, how long each operation took, and how all of it fits together across service and agent boundaries. For a distributed system, that’s a remarkably complete picture. For an AI system, it’s necessary but not sufficient.
Response quality is a big part of the gap. A trace can tell you that an LLM call completed in 340 milliseconds and returned 412 tokens. It can’t tell you whether the response was accurate, whether it stayed within policy, or whether the retrieval context that informed it was relevant to the question being asked. A confident hallucination and a well-reasoned answer look identical in a trace. Structural telemetry, by design, captures the shape of execution — not the value of what was produced.
This is a difference that makes a difference. Traces, metrics, and logs are objective and largely universal. Output quality, on the other hand, is neither objective nor universal — it’s domain-specific, often partially subjective, and can only be assessed by something that understands what a good response looks like within the relevant context. That’s a different class of measurement, and it requires a different class of tooling if it’s going to furnish a basis for moving from insight to action.
What sits downstream of the trace is evaluation: tooling that takes the inputs and outputs your instrumentation has captured and asks whether the system is actually doing its job well. That means assessing response quality, measuring whether retrieved context was relevant, checking outputs against safety and policy constraints, and tracking cost relative to the value being produced. These signals are what differentiate a well-observed AI system from one that simply has good infrastructure monitoring — and capturing them meaningfully is what Part 4 of this series is about.
The handoff is clean in principle: OTel captures what happened; evaluation assesses whether it was any good. In practice, the two layers need to be integrated — evaluation tooling must be able to read the traces your instrumentation produces, and the signals it generates must feed back into the same system you’re using to debug infrastructure and execution issues. That integration is part of what makes assembling this stack from scratch harder than it looks, and part of what a well-constructed distribution has to solve.
How Do You Know What to Measure Once OTel has Laid Bare Your Generative AI Technology Stack?
You can’t monitor AI systems from a single vantage point. The way things are being done now, every layer is both an instrumentation target and a potential source of misleading signals for the layer above it.
The architecture tells you where to instrument, but an equally challenging question is what to measure once you’re there. Traditional telemetry — traces, metrics, logs — simply isn’t enough for the burgeoning, interlocking system of AI agents. The signals that actually differentiate a well-observed AI application from a poorly-observed one are quality, safety, and savings with respect to both time and cost; and capturing them meaningfully requires a different kind of instrumentation than that necessitated by distributed tracing.
It is to this that we will turn in Part 4.
In the meantime, you can download our v0.1 observability pipeline on Prove AI’s GitHub, and you’re welcome to contact our team directly if you have any questions.
Frequently asked questions
Prove AI is building solutions to power more correct, explainable and auditable AI outcomes.
We’re always interested in learning about AI management challenges.
Get in Touch