If Part 1 made the case for AI observability, Part 2 provides a blueprint for building the foundation for end-to-end visibility across your AI ecosystem. Before you can decide what to instrument, what guardrails you need, how best to detect anomalies or establish robust guardrails, you need a clear picture of what you’re actually looking at.
The challenge is that a production AI system is not a single thing you monitor from a single vantage point, it’s a layered architecture. As a result, if something breaks in one location and makes itself known in another–which may not be the case with especially subtle and silent errors–it will often do so in a form that makes tracking it back to its origin incredibly difficult.
Chatbots are the clearest example: the failures users actually encounter are rarely dramatic crashes or obvious errors. There are subtle degradations in response quality, plausible-sounding answers that quietly miss the point, context that gets lost across turns. The root cause of those failures is almost never where the symptom appears, meaning that to move into the next phase of AI observability, you need a comprehensive view into your infrastructure to properly diagnose and remediate issues.
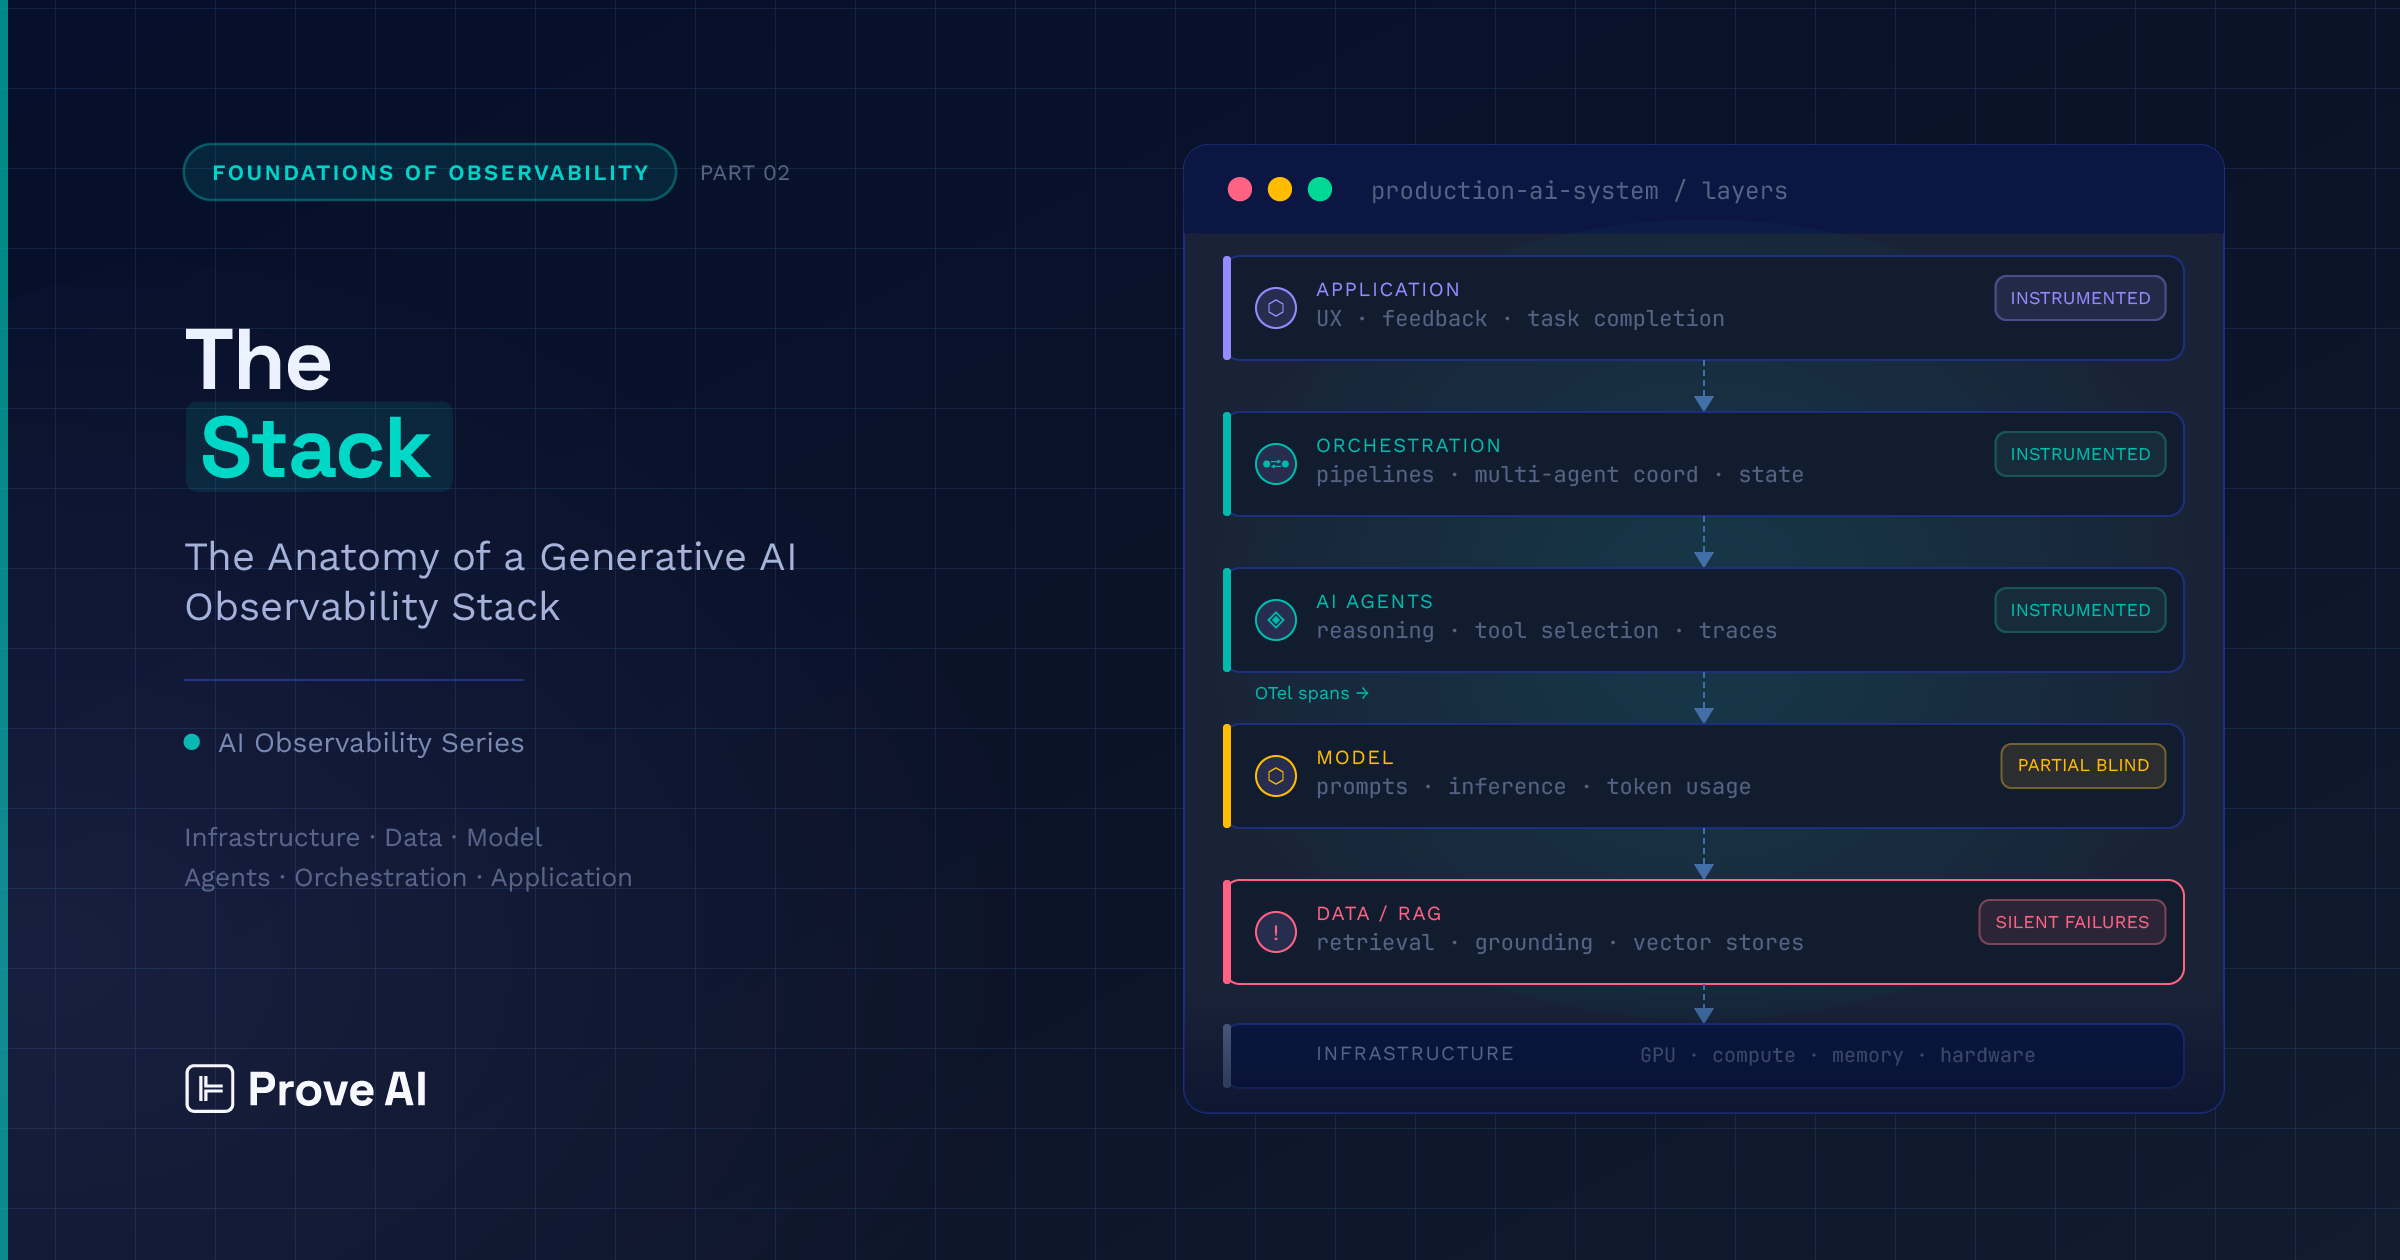
Walking the Layers of the Generative AI Technology Stack
The most useful way to understand an AI observability platform is bottom-up, starting with the infrastructure your models and AI agents actually run on and working toward the experience your users actually have. There are many ways of dividing up a technology stack like this; the one we’ll use delineates between:
- Compute and infrastructure
- Foundation model and reasoning
- Data and context
- Trust, evaluation, and security
- Orchestration and execution
- Application
Here’s a summary, feel free to refer back to it as you read so that you can keep the full picture in mind.
Compute Problems Often Hide in the Infrastructure Layer
At the foundation of the stack sits the hardware your models actually run on — GPU and compute resources, memory allocation, utilization rates, and the scaling parameters that govern how your system responds under load. Failures here are not always announced as hardware failures; for example:
- A saturated GPU queue may surface as response latency.
- Memory pressure during inference manifests as output inconsistency.
- A cold start from an autoscaling event gets logged as a slow model response.
By the time any of those signals reach an engineer, the trail back to the infrastructure layer is likely already cold.
Compounding this general misattribution problem is the cost dimension: compute utilization and token throughput are the basis for any meaningful cost observability story, and without instrumentation at this layer, anomalies related to cost are just as hard to trace as those related to quality. Though there is a growing recognition of the need for top-to-bottom observability, infrastructure is the layer most teams assume is covered by existing tooling — and it often is, at the level of raw metrics. What’s rarely covered is the connection between those AI metrics and the quality and latency signals appearing multiple layers up.
Prompt Decisions Compound at the Foundation Model and Reasoning Layer
Sitting directly above infrastructure is the underlying LLM — prompt construction, inference configuration, context window management, and raw response generation are all operative here. Failure modes that occur at the foundation model layer are more subtle than those stemming from infrastructure, and correspondingly harder to attribute precisely because they interact with every layer above and below.
Model versioning adds another variable that most teams underestimate: a silent provider-side update can shift output behavior without any change on your end, and without instrumentation that captures model identifiers alongside outputs, you may not connect the regression to its cause for days.
Another thing worth pointing out is that prompt changes deserve the same treatment as code changes — versioned, tested, and observable — because a modification to a system instruction or few-shot example can degrade output quality across your entire application without triggering a single conventional alert.
Silent Retrieval Failures Live in the Data Layer
Above the model layer sits the retrieval and grounding infrastructure that determines what your LLM actually reasons over, which can include vector stores, embedding pipelines, document retrieval, and context assembly, among other things. This is one of the most consequential layers to instrument, and one of the least forgiving to leave in the proverbial shadows. By design, retrieval failures are silent: when your retrieval system returns stale, irrelevant, or low-confidence documents, the model has no native data lineage mechanism to surface that failure, meaning that it will reason over whatever it’s given, produce a plausible-looking response, and move on.
Embedding drift exacerbates these difficulties; as your underlying data changes, the vector space that was initially accurate will gradually stop reflecting reality, degrading retrieval quality in ways that are nearly impossible to detect without explicit monitoring of relevance scores and document freshness.
The order in which context is assembled adds an additional wrinkle: what gets truncated when the context window is full affects output quality in ways that are rarely obvious and even more rarely logged.
Taken together, the data and context layer is where the most common class of production AI failures originates, and for the same reason, is where teams with insufficient instrumentation spend the most time debugging symptoms that appear two or three layers above the actual cause.
AI Observability Becomes Categorically Different with Trust, Evaluation, and Security
This is the layer that has no direct analog in traditional software observability — and the one that most clearly marks the boundary between monitoring an AI system and actually understanding it. Quality, safety, and cost are three signal types that don’t exist in conventional telemetry, and instrumenting them with a tool like Prove AI requires a different approach than distributed tracing alone.
With respect to quality, LLM-as-judge patterns have emerged as the practical evaluation mechanism, with metrics like faithfulness, answer relevancy, and context precision and recall giving teams a systematic way to assess whether responses are grounded, accurate, and useful (rather than just fast). Where safety is concerned, guardrails need to be instrumented, not just deployed; knowing that a safety layer exists is different from knowing when it fires, when it should have fired but didn’t, and what it’s costing you in latency when it does. Prompt injection and PII leakage are failure modes unique to this layer, and both are invisible without explicit detection logic. Cost attribution, for its part, sits here too — token consumption, inference spend, and evaluation overhead need to be tied to specific requests, users, and workflows before cost anomalies become actionable as opposed to just alarming.
In practice, most teams reach this layer last, but it should be treated as a first-class instrumentation target from the start. The signals it produces are the ones that most directly reflect whether your AI system is doing what you built it to do.
Execution Architecture Determines What You Can See
The AI orchestration layer is really where the complexity of modern AI systems is brought into starkest relief, and where the gap between what teams think they’re observing and what’s actually happening tends to be widest.
This layer spans a significant range of execution architectures; we won’t cover them all, but examples include:
- A single prompt-response exchange
- RAG pipelines with model routing
- ReAct-style multi-step chains
- Full multi-agent systems with shared state and memory across coordinating subagents
Each architecture introduces distinct failure modes, and the instrumentation requirements change substantially as you move up that complexity curve. A single prompt is (relatively) straightforward to trace; a multi-agent workflow where four AI agents are passing state between tool calls is not (to put it mildly).
As you might expect, the hardest failures at this layer are the ones that don’t produce loud, obvious errors. Consider, for example, an AI agent that selects the wrong tool on step three of a seven-step chain, continues executing, and produces a plausible-looking result. Under most setups, this would surface as a quality issue at the application layer, with no indication of where the chain broke down.
Many common frameworks provide some built-in visibility, but framework-level logging for agentic workflows doesn’t automatically give you the cross-agent traceability you need to debug failures that span multiple reasoning steps and tool invocations. Or, as Prove AI’s CTO Greg Whalen aptly summarized it:
“If your traceability data doesn’t include intermediate reasoning steps and tool call sequences, you don’t have visibility into your agent system; you have visibility into its inputs and outputs, which is a different thing entirely.”
Instrumenting this layer means capturing intermediate reasoning steps, tool call sequences, and state transitions, not just inputs and outputs. Without that, you’re not observing your AI orchestration layer; you’re observing its edges.
The Application Layer is the Most Visible (and Least Diagnostic)
At the top of the stack sits the AI application layer. This is the one that most teams instrument first, and which, coincidentally, is the one that usually tells you the least about what’s actually wrong. User-facing latency, task completion rates, conversation quality, session abandonment, and feedback signals like thumbs down or repeat queries are all application-layer metrics.
These are absolutely worth capturing, but they’re symptoms, not causes. A degraded user experience at the AI application layer could originate from GPU contention four layers down, a retrieval failure two layers down, a broken agent chain one layer down, or any combination of the three — and the application layer signal alone won’t tell you which.
That said, there’s a specific way in which this layer is underutilized as an observability input: user behavior signals are richer diagnostic data than is appreciated by most teams. A user rephrasing the same question three times is signaling something about response quality that no infrastructure metric will surface. Session abandonment patterns, task completion rates, and feedback loops tie all the technical machinery back to the outcome that actually matters (whether the system is useful to the person using it).
The AI application layer rarely tells you what’s wrong, but it’s often the first place you know that something has gone off the rails, which makes it the correct starting point for a diagnostic workflow that then traces downward through the stack.
Why Infrastructure Problems Look Like Quality Issues at the Application Layer
The cash value of this stack framing is aiding in anomaly detection, ensuring correctness, and boosting live performance in the context of stochastic generative AI systems, whose failure modes are numerous and subtle.
Without proper LLM observability, a degraded user experience is just a degraded user experience — a signal that something is wrong and not much else. With it, that same degraded experience becomes a starting point for structured investigation. Did the RAG system receive bad context? Did an AI agent select the wrong tool? Is infrastructure contention introducing latency that’s being misread as quality degradation?
These are normal failure modes of production AI systems, and they’re systematically invisible without visibility across the full stack.
A good observability solution gives engineers a vocabulary for debugging AI across layers, not just within them.
Going from Ad Hoc Debugging to Systematic Remediation
There’s a practical corollary here that’s worth naming explicitly. Even with a comprehensive observability platform in place, production AI systems will surface more issues than any team can meaningfully investigate. Engineers can realistically dig into a handful of issues per day; a well-instrumented system will surface many more than that.
This is why you can think of the stack as “a diagnostic map” as much as it is an architectural concept. When a failure surfaces at the application layer, an AI observability platform like Prove AI tells you where to look first — which layers are most likely to contain the root cause, which metrics to pull, which dependencies to interrogate. Without that map, investigation tends to be ad hoc, more akin to fumbling around in a lightless cave than a proper search. With it, however, investigation becomes something you can prioritize systematically: start at the layer where the signal first appears, trace the cascade, and scope the problem before committing to a deep dive.
Understanding the stack is what makes prioritized investigation tractable. It doesn’t eliminate the Three Issues Problem, but it gives you the structure to navigate it.
Building on the Architecture Foundation
Knowing where to instrument is a prerequisite for knowing what to measure, but it’s exactly that — a prerequisite. The signals that actually differentiate a well-observed AI system from a poorly-observed one aren’t captured by infrastructure metrics or application-layer dashboards alone. They require instrumentation that speaks the same language (a lingua osserva, if you will) across every layer of the architecture described here.
That’s what OpenTelemetry makes possible, and it’s where this series goes in part 3. There, we’ll discuss OTel in depth: what it is, how it’s extending into AI-specific workloads, and how to put it to work across the stack you’ve just mapped.
You’re welcome to join us there, or you can go to Prove AI’s GitHub to download our v0.1 observability pipeline to get started right away. Please also reach out to our team if you’d like to chat, we love hearing from the community!
Frequently asked questions
Prove AI is building solutions to power more correct, explainable and auditable AI outcomes.
We’re always interested in learning about AI management challenges.
Get in Touch